In today’s highly competitive business world, it is crucial for companies to continuously optimize their production processes. One of the most effective ways to achieve this is to use key performance indicators (KPIs) – metrics that measure a company’s performance in various areas.
Production key figures are the foundation of efficient production control
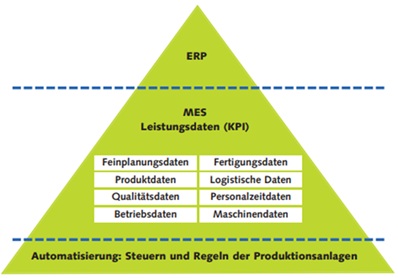
Production key figures are much more than just numbers on a dashboard; they are the foundation for efficient and targeted production control. They enable companies to make processes transparent, respond to changes in a timely manner, and continuously improve production. The systematic determination and analysis of these production KPIs, supported by DOQ-MES Medical Technology, provides a solid basis for optimizing operational processes and the strategic orientation of production companies. After all, precision and efficiency determine the market. With clear production key figures, you always have the key to your company’s success in view and can react in a timely manner.
How can KPIs be determined and measured in production?
Determining and measuring production metrics are systematic processes that require both accurate data collection and careful analysis. Here are the basic steps for defining these important metrics in your company:
Step 1: Set goals
Define what you want to measure and why. Ask yourself, “What are our most pressing challenges in production?” For example, do you want to shorten throughput time, improve quality, or reduce costs? These goals should be specific and measurable, and you should be able to monitor them using the appropriate metrics.
Step 2: Data collection and analysis
Collect operational data from the production chain, such as processing times, good/bad parts, machine data, and material and resource consumption. It is important to maintain consistent data. Communicate your goals to your employees and explain the importance of accurate data collection. Collected data can be extracted directly from the DOQ database or from specific process queries using the DOQ evaluation tool. If additional machine data is to be collected, our DOQ – Smart Machine Monitoring can be used for this purpose.
Then analyze this data to extract meaningful information. This is where statistical methods and analysis tools such as Microsoft Power BI come into play.
Step 3: Reporting and continuous improvement
Present the results to employees and management in the form of dashboards and reports. Regular reviews of key performance indicators support the continuous improvement of production processes.
Top 8 KPIs in production and their added value for decision-making
Production metrics are indispensable tools for management to make informed, data-driven decisions. Here we present ten of the most important metrics in production and explain how they can contribute to optimizing operational processes and strategic planning:
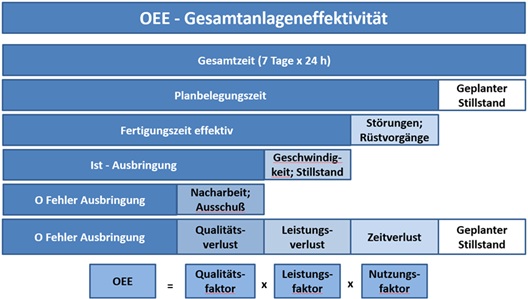
- Overall Equipment Effectiveness (OEE)
This metric evaluates the overall performance of a production facility. It takes into account the factors of availability, performance, and quality to provide a comprehensive assessment of production effectiveness. A detailed calculation of OEE can be understood using simple formulas that represent a combination of the factors mentioned. An infographic could be used to illustrate how OEE is calculated. An MDE on each machine is a prerequisite for determining overall equipment effectiveness.
- Lead time
Measures the time from the start to the end of the production process. A shorter lead time improves responsiveness to customer requirements and increases flexibility.
- Scrap rate
Shows the percentage of production that does not meet quality standards. A reduction in the scrap rate leads directly to cost savings and higher customer satisfaction.
- Rework rate
This key figure indicates how much rework is required, which provides information about the efficiency and quality of the manufacturing processes.
- Right First Time (RFT)
This key figure is a meaningful indicator of the performance and precision of the production process as well as the overall quality of manufacturing.
- Utilization rate
Determines how well production capacities are being utilized. Optimizing the utilization rate can lead to significant efficiency gains. With DOQ-MDE, you can visualize the utilization of production machines by recording their status.
- Cycle time
The cycle time is the rate at which a product must be manufactured to meet customer demand. Optimizing the cycle time can lead to more consistent and efficient production
- Capacity utilization
Shows how close the actual production volume is to the maximum possible capacity. High capacity utilization is often a sign of good market demand, but can also indicate overload.
What distinguishes KPIs from production statistics?
Key performance indicators are values calculated from production factors and presented as percentages. They are an indicator of how well an aspect of production is developing over time. When looking at KPIs, the focus is on achieving strategic target values and observing changes. Production statistics, on the other hand, focus on the observation of specific frequencies and the duration of events or conditions at specific production facilities. In contrast to KPIs, this usually includes operational values such as unit numbers, cycle times, or the duration of events.
Communication tool
KPIs are objective assessments of production status and help to objectify discussions about perceived performance or the causes of problems in teams or departments. Since KPIs provide an objective picture of current performance, there is no need to rely on the gut feelings of individual employees. At the same time, KPIs can also represent a goal to be achieved or used for comparison. Under the right conditions, such common goals can have a motivating effect and promote interdisciplinary and cross-departmental collaboration. This applies not only to colleagues within teams, but also to reporting to management.
Proactive measures
Taking action before a problem arises is considered the supreme discipline in production management and monitoring. That is why expectations for topics such as predictive maintenance are very high. A simple introduction to this can be made at the KPI level. Changes in KPIs such as “process performance” can, for example, already indicate problems that can be remedied through more detailed analysis. Although KPIs cannot replace predictive maintenance, they are a first step in preparing new processes to alert experts to potential problems at an early stage.
Reactive measures
Before you can learn from mistakes, you first have to recognize them. Subtle and gradual process deterioration poses a particular challenge in this regard. KPIs are ideal for this purpose, as they allow longer periods of time to be analyzed and compared. Changes in KPIs point to specific periods of time, which can then be used to search for causes in technical process values.
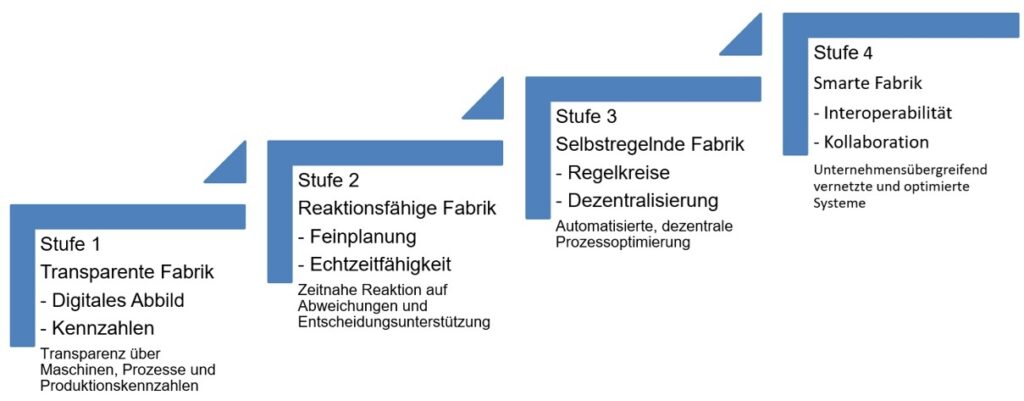
The 4 stages of digitalization in manufacturing companies
Conclusion
KPI metrics are an indispensable tool for companies in production and the move towards smart factories.
Please feel free to contact us if you would like to achieve greater transparency in your company.